
SaaS Analytics Guide: What Is It and Best Tools
SaaS analytics show the reality of your business.
In your data, you can find insights into what is working and what isn’t. But to get an accurate picture of this, you need SaaS analytics tools.
Start measuring the right metrics and see exactly the state of your company.
What is SaaS analytics?
SaaS analytics is the monitoring of user information in cloud-based software. It aids companies in comprehending the use of their products so businesses observe how clients use their offerings. Better product choices are guided by this understanding.
Key performance indicators are measured via SaaS analytics solutions, such as annual recurring revenue (ARR), churn rate, and active users. They also monitor client engagement and revenue development. Real-time data collection is done.
Reports are produced on auto-pilot, which gives a comprehensive picture of the state of the company.
What are analytics SaaS tools?
SaaS analytics solutions are cloud-based applications that assist companies with data analysis. These are tools that provide insights without requiring local hardware.
Through the internet, users can use these technologies, enabling remote collaboration and work. These platforms allow for the seamless integration of data from multiple sources.
The tools expand with the business. Because of the SaaS approach, they deliver real-time data analysis at a reasonable cost.
According to Gartner customer analytics applications are the fastest-growing sector within the SaaS market.
Key features of SaaS analytics tools
Here’s an overview of the main features of SaaS analytics software that impact businesses.
The ability to scale
SaaS tools expand along with your company. They adjust to the growing demands for data, whether you are tracking marketing ROI or deep-diving into engineering metrics to optimize your development pipeline. Features are simple for users to update or change as requirements evolve.
Availability
You can get these tools online. Everywhere, at any time, users can access them. An internet connection is all that is required.
Integration
Existing software can be used with SaaS analytics solutions. They have access to numerous data sources. Data management is made easier by this. The utilization of open source ETL tools with existing software facilitates seamless data management and access to diverse data sources.
Instantaneous Analysis
Data is updated instantaneously. Users easily obtain up-to-date insights. Making judgments on time is aided by this.
Cost-effectiveness
No requirement for tangible infrastructure. This lowers the cost of IT. Additionally, subscription models reduce up-front costs.
Security
Security upgrades are managed by security providers. Cloud storage offers safe data storage. This guards against threats and data loss.
Personalization
A tool can be customized to meet a certain requirement. The user experience is improved by custom features. They satisfy particular corporate needs.
Features That Promote Collaboration
It is possible for multiple users to collaborate. They can exchange reports and insights. Working together is simple and productive.
Do you need SaaS analytics?
What gets measured gets managed. It is a much better approach for businesses to make informed decisions based on data extracted from applied statistics, rather than in the dark. SaaS analytics brings light to your data so you can make the best decisions. The bigger the company, the more impact SaaS analytics has. However, even small businesses can benefit from this. These are the main ways your business can leverage SaaS analytics.
Enhancing Customer Understanding
SaaS analytics are crucial since they offer an in-depth understanding of user behavior and highlight the most and least popular features.
Businesses may customize their offers to match certain demands by knowing how customers interact with their goods, which leads to improvements that are well-received by users. Businesses can improve consumer satisfaction by this careful observation, and higher retention rates are directly related to it.
Businesses may remain ahead of expectations and lower churn rates by using the predictive power of SaaS analytics to forecast client needs and modify their tactics accordingly. This boosts profitability and promotes steady business growth.
Improving Operational Efficiency
By automating the analytical process and improving data collection, SaaS analytics dramatically increase operational efficiency while saving money and time.
These instruments’ real-time data facilitates speedier decision-making, which helps firms stay competitive and adaptable in quickly changing marketplaces. Leveraging tools to label data allows companies to structure their information with precision, unlocking deeper insights and enhancing the quality of strategic choices.
SaaS analytics detects operational inefficiencies and promptly makes adjustments to reduce resource waste and ensure optimal resource use. This optimization results in improved service delivery, which draws in more clients and aids companies in keeping a competitive edge—a necessity for continued existence and market success.
Driving Revenue Growth
Businesses may maximize marketing return on investment and optimize advertising spend by using SaaS analytics to pinpoint the most profitable prospects and marketing channels. Enhanced efficacy in promotional endeavors frequently prompts further financial outlays.
By offering thorough tracking of sales activity and conversions, SaaS analytics also improve sales strategies by enabling fine-tuning that increases revenue and sales.
These technologies support solid financial planning, future growth assurance, market share expansion, and, ultimately, market dominance.
What are the key metrics you can track?
Make sure you track these metrics to get a better view of your SaaS.
Key Business Performance Metrics
Tracking key business performance metrics helps evaluate a company’s overall health and growth trajectory. Here are some essential metrics:
- Revenue: Total business income.
- Profit: Earnings after costs.
- Growth Rate: Speed of business expansion.
- Customer Lifetime Value (CLV): Predicted revenue from a customer.
- Customer Acquisition Cost (CAC): Total cost to acquire a new customer.
- Churn Rate: Percentage of customers lost.
- Net Promoter Score (NPS): Customer loyalty assessment.
- Conversion Rate: Percentage of transactions completed.
- Employee Satisfaction: Workforce happiness.
- Operational Efficiency: Effectiveness of processes.
- Market Share: Position within the industry.
- Return on Investment (ROI): Profitability ratio.
- Cost per Lead (CPL): Expense of generating leads.
- Inventory Turnover: Efficiency in managing stock.
- Cash Flow: Movement of money in and out.
Key Marketing Metrics
Marketing metrics provide insights into the effectiveness of advertising and promotional strategies. Important metrics include:
- Impressions: Number of content views.
- Click-through Rate (CTR): Effectiveness of ads.
- Engagement Rate: Level of interaction.
- Bounce Rate: Visits that end on the entry page.
- Lead Generation Rate: Count of potential clients.
- Social Media Followers: Audience size.
- Email Open Rate: Interest in messages.
- Blog Traffic: Popularity of content.
- Cost per Acquisition (CPA): Cost to acquire a customer.
- Brand Awareness: Level of recognition.
- Customer Retention Rate: Percentage of retained customers.
- Page Views: Number of website visits.
- SEO Ranking: Position in search engines.
- Influencer Impact: Effectiveness of influencers.
- Affiliate Sales: Success of referral programs.
Key Financial Metrics
Financial metrics are critical for assessing a company’s fiscal health and investment potential. They include:
- Gross Margin: Profitability from selling goods.
- EBITDA: Earnings before interest, taxes, depreciation, and amortization.
- Operating Cash Flow: Money from business operations.
- Debt-to-Equity Ratio: Creditor vs. investor stake.
- Quick Ratio: Ability to cover short-term obligations.
- Current Ratio: Asset to liability coverage.
- Days Sales Outstanding (DSO): Age of accounts receivable.
- Capital Expenditure: Investment in fixed assets.
- Return on Equity (ROE): Returns to shareholders.
- Revenue per Employee: Productivity indicator.
- Financial Leverage: Level of debt.
- Interest Coverage Ratio: Ability to pay interest.
- Dividend Payout Ratio: Distribution to shareholders.
- Net Asset Value: Total asset value.
- Working Capital: Funds available for operations.
Best SaaS Analytics Tools
These analytics software tools can help SaaS businesses and all other types of companies.
Amplitude
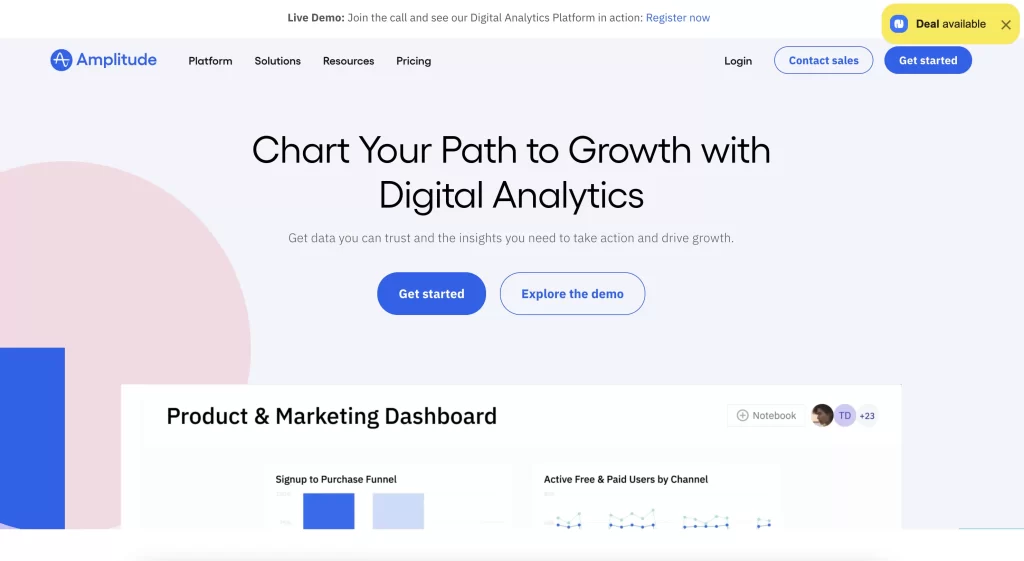
Amplitude is a software analytics platform made to assist companies in comprehending and optimizing user behavior on their digital products.
Analysis: Key Features, Benefits & Considerations
It offers a thorough framework for monitoring user interactions, carrying out in-depth analysis, and displaying data to throw light on the user journey.
Amplitude’s ability to connect data from different teams and platforms is one of its key advantages; it helps businesses generate a unified view of their consumer data.
Features like automation and AI-powered insights, which speed up the analysis process and offer useful advice based on user behavior, further improve this.
Amplitude pricing information
Save 25% or get 1 free year by subscribing through the NachoNacho Marketplace.
- Starter: $0/month
- Plus: From $49/month
- Growth: Custom pricing
- Enterprise: Custom pricing
Dokin
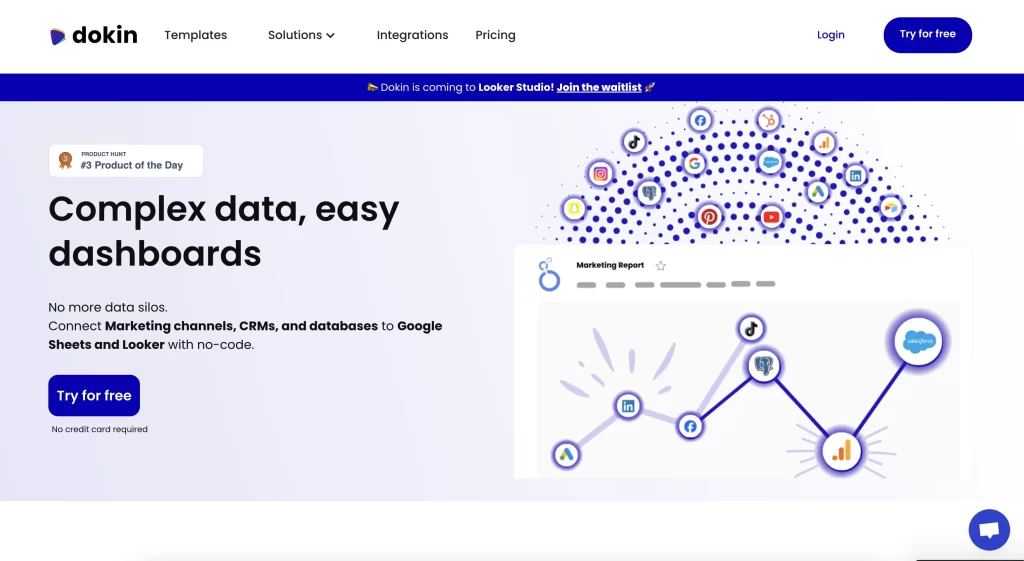
Dokin is an analytics solution that focuses on organizing and integrating data without the need for scripting across a variety of Google Workspace applications.
Analysis: Key Features, Benefits & Considerations
Connect with Google Sheets, Slides, and Docs.
It enables users to instantly sync and update data from a variety of sources, including databases like PostgreSQL, project management applications like Trello and Jira, and CRM systems like HubSpot.
Dokin pricing information
Save 30% on Dokin by subscribing through the NachoNacho Marketplace.
- Premium: $39/month
- Team: $119/month
- Agencies: Custom pricing
Bright Data

With support for managing proxies, automating activities, and accessing difficult-to-scrape websites, Bright Data is an analytics software application that offers enterprises comprehensive proxy services and data scraping capabilities.
Many organizations also pair these capabilities with an AI web scraper to simplify data extraction from dynamic websites and reduce manual effort.
Analysis: Key Features, Benefits & Considerations
Bright Data has a Proxy Manager built in and proxy browser extension, providing functionalities for web unlocking.
Data collection is much easier with the provided templates.
600,000+ global IP addresses are part of the network, and it’s easy to use.
Bright Data pricing information
Save 10% on Bright Data by subscribing through the NachoNacho Marketplace.
- Pay as you go: Custom
- Micro-package: From $10/month
- Growth: From $499/month
- Business: From $999/month
Calqulate
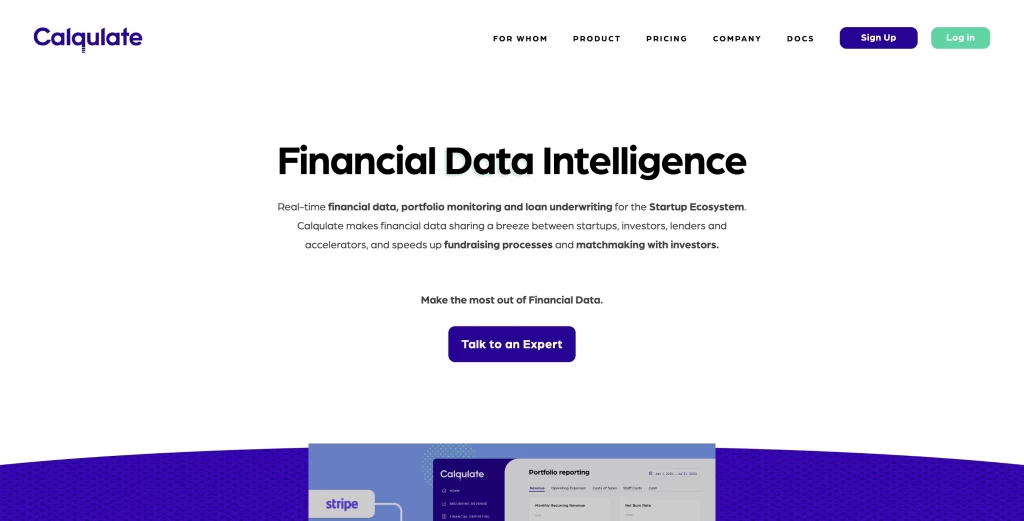
Calqulate is cutting-edge financial analytics tool designed especially for SaaS and subscription-based businesses. It provides a set of tools that empower CFOs.
Analysis: Key Features, Benefits & Considerations
Businesses may optimize cash flow management, strengthen financial organization, and successfully get ready for investment rounds with just a 15-minute setup.
Businesses may make educated decisions by using Calqulate’s vital growth metrics tracking, which includes revenue analysis, unit economics, retention analysis, and revenue forecasting.
Extra tools like subscription payment management and cash management dashboards assist firms in streamlining their financial operations even more.
Calqulate pricing information
Save 30% on Calqulate by subscribing through the NachoNacho Marketplace.
- Free: $0/month
- Analytics + Fundraising: $49/month
Databox

Databox is a platform for company analytics that improves decision-making by combining data from numerous sources, such as HubSpot, Google Analytics, Facebook Ads, and Google Ads, into customizable dashboards and reports.
Analysis: Key Features, Benefits & Considerations
Businesses can effectively and continually monitor their key performance indicators (KPIs) thanks to this integration capability and the ease of access on various platforms, including mobile, browsers, TV displays, and even apps like Slack and Apple Watch.
With the platform’s more than 70 integrations, you can easily and without coding knowledge create personalized dashboards.
Databox pricing information
Save 15% on Databox by subscribing through the NachoNacho Marketplace.
- Free: $0/month
- Starter: From $59/month
- Professional: From $169/month
- Growth: From $399/month
- Premium: From $999/month
Discern
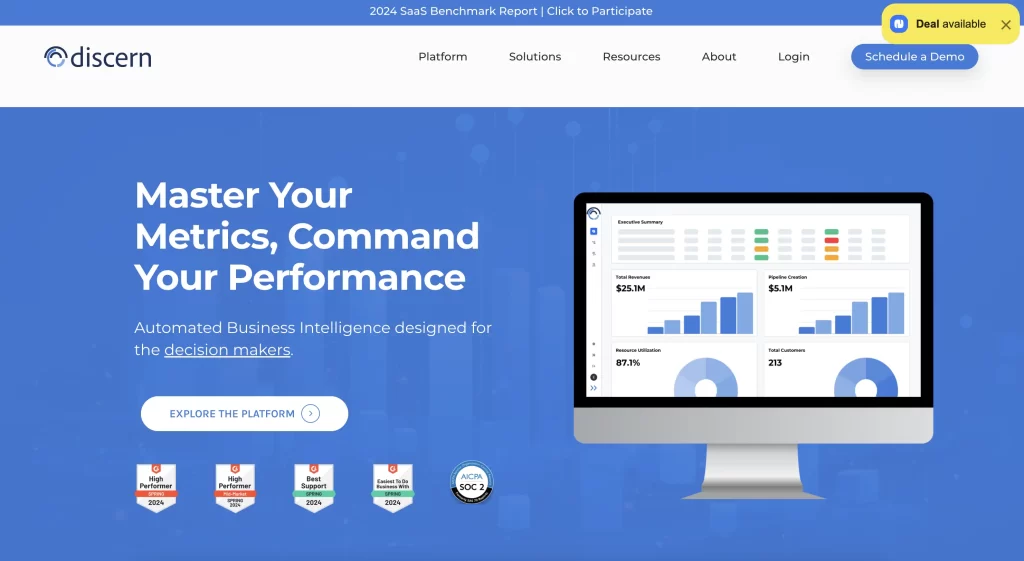
Discern is a business operations and intelligence platform that is intended to improve the ability to make decisions in a variety of organizational domains, including finance, customer success, sales, and marketing.
Analysis: Key Features, Benefits & Considerations
This tool easily integrates with any system to centralize information from these various industries, enabling a comprehensive understanding of how businesses operate.
Discern offers a comprehensive suite of embedded analytics customized for every business function, and it can compute and track hundreds of operational and financial KPIs from a single control panel.
Detect patterns, automate insights, and obtain strategic guidance.
Discern pricing information
Save 15% on Discern by subscribing through the NachoNacho Marketplace.
Contact the Discern sales team to get more pricing information.
Explo
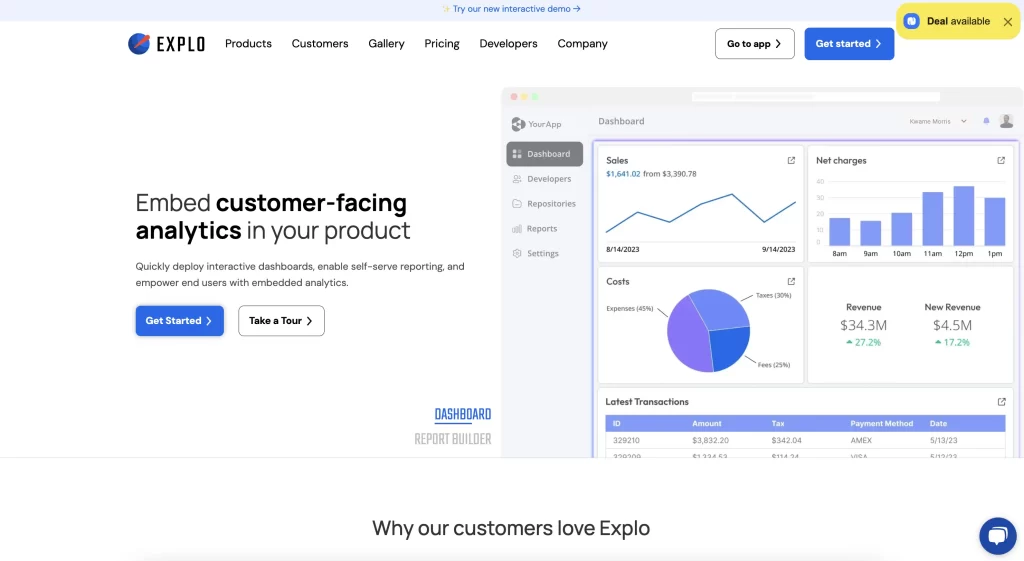
This is a reporting tool and embedded analytics software that helps firms present and work with data more effectively.
Analysis: Key Features, Benefits & Considerations
With the help of this platform, businesses can incorporate advanced, configurable analytics straight into their products, giving end users access to, control over, and interaction with data that closely resembles the host application’s look and feel.
With the ability to customize dashboards, Explo enables companies to provide a customized data exploration experience for their clients, complete with editable dashboards and customized reports.
Explo pricing information
Save 10% on Explo by subscribing through the NachoNacho Marketplace.
- Launch: $0/month
- Growth: From $695/month
- Pro: From $1,995/month
- Enterprise: Custom pricing
Factors.ai
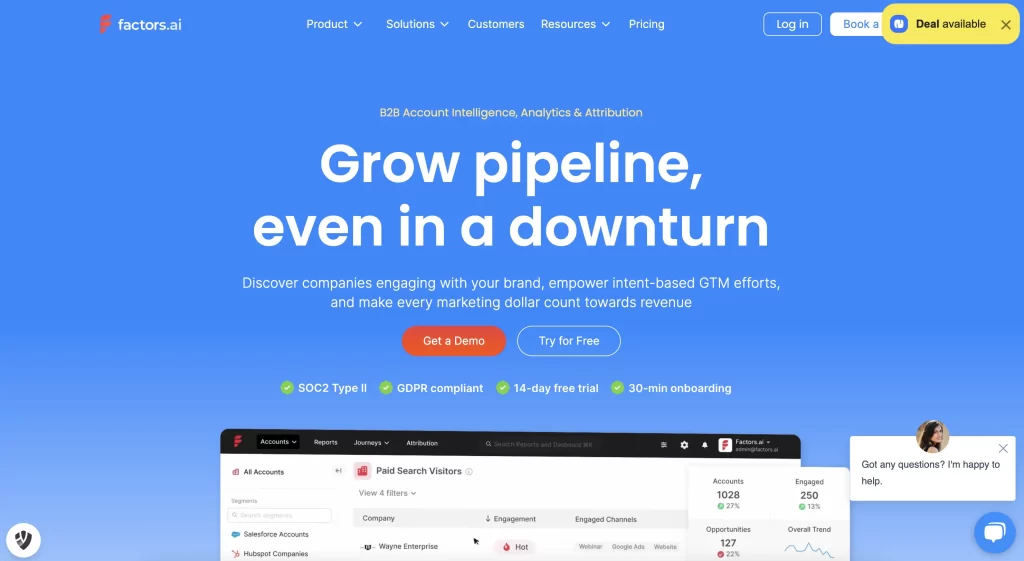
Factors.ai is a sophisticated B2B marketing analytics and revenue attribution software designed to enhance marketing strategies and optimize return on investment.
Analysis: Key Features, Benefits & Considerations
Factors.ai offers a single view of the sales and marketing funnel by integrating data from several consumer touchpoints, including ads, website interactions, downloads, webinars, and sales activities.
With this all-inclusive strategy, businesses can track consumer behavior and gauge how well their marketing initiatives are generating income and expanding their pipeline.
Factors.ai is an AI-powered automation and machine-learning platform that provides actionable insights and eliminates the need for manual data analysis.
This frees up marketing teams to concentrate on making strategic decisions and customizing their campaigns to achieve better results.
Factors pricing information
Save 15% on Factors.ai by subscribing through the NachoNacho Marketplace.
- Free: $0/month
- Basic: From $249/month (billed annually)
- Growth: From $799/month (billed annually)
- Custom: Custom pricing (billed annually)
Kissmetrics
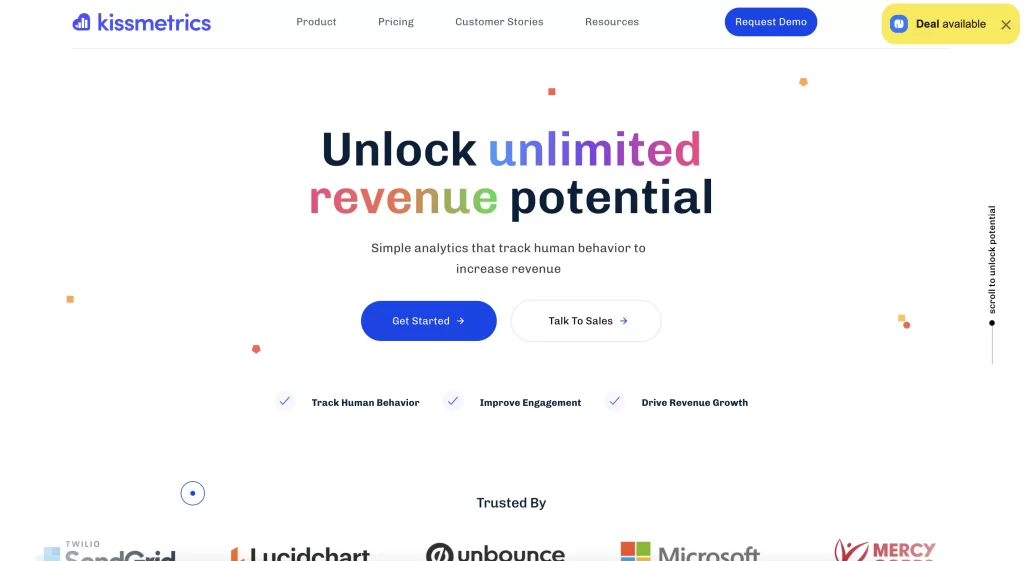
Kissmetrics is an analytics platform that provides thorough insights into consumer behavior and conversion processes to product and marketing teams.
Analysis: Key Features, Benefits & Considerations
It makes it simpler to find prospects and turn them into customers by combining important metrics and features into a single dashboard.
Kissmetrics helps organizations better target their marketing efforts by providing insights into customer trends within particular cohorts through segmentation and deep behavioral analytics.
This application monitors users who are actively involved and their interactions over time, linking certain events to user behavior and determining which features and sites attract the most active users.
Kissmetrics pricing information
Save 30% on Kissmetrics by subscribing through the NachoNacho Marketplace.
- Build your plan: From $25.99/month for 10k events
- Pay as you go: From $0.0025/event
Supermetrics
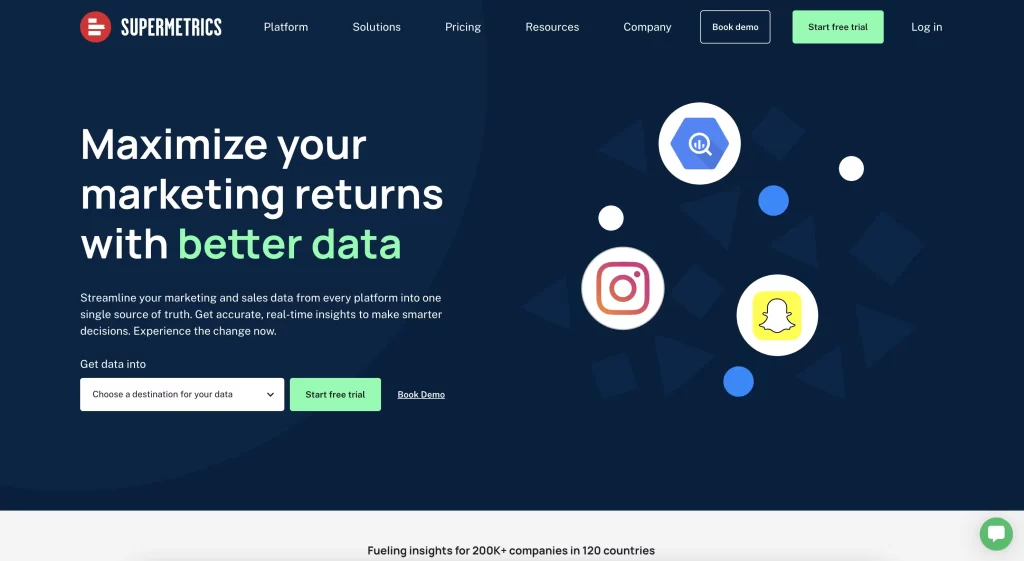
Supermetrics is a powerful analytics solution that helps businesses make better decisions based on data by streamlining the process of managing and integrating data.
Analysis: Key Features, Benefits & Considerations
Easy and effective data extraction is made possible by its seamless connectivity to a variety of social networking sites, Shopify, Google Analytics, and other marketing and sales platforms.
Businesses can easily create dashboards and reports because of this connectivity, which drastically cuts down on the amount of time needed for manual data collection.
Supermetrics saves time and facilitates fast decision-making by automating these processes, freeing up teams to concentrate on data analysis and insights.
Supermetrics pricing information
Save 15% on Supermetrics by subscribing through the NachoNacho Marketplace.
The pricing of Supermetrics will depend on the sources of your data. Here are a few examples:
- Looker Studio: From $29/month
- Google Sheets: From $29/month
- Microsoft Excel: From $29/month
- Power BI: From $29/month
- Monday.com: From $19/month
Whatagraph
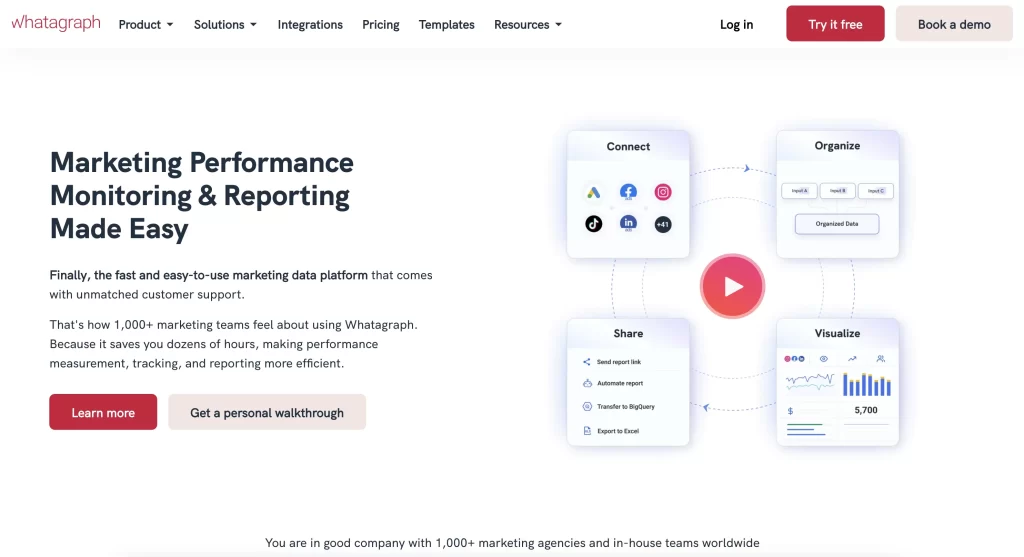
Whatagraph simplifies the creation of personalized dashboards, providing a comprehensive view of multiple metrics and KPIs. This tool enables marketing agencies to customize reports with their own branding, making it easier to present data in a visually appealing way.
Analysis: Key Features, Benefits & Considerations
Automates the reporting process entirely, enabling real-time updates through integrations with various data sources including Google Analytics, Facebook Ads, and more. Whatagraph allows users to generate detailed insights that align with client expectations.
Whatagraph pricing information
Various plans available based on customization needs and viewership.
Coupler.io
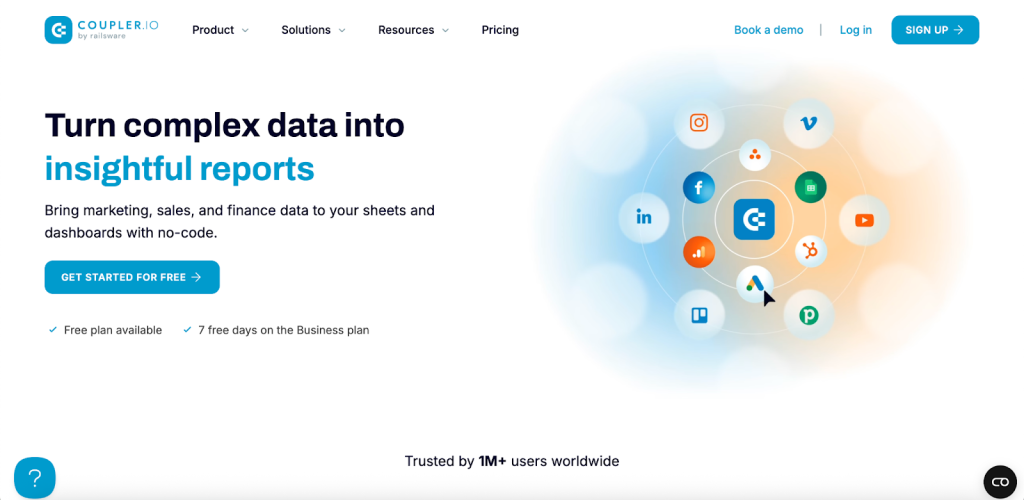
Coupler.io helps businesses automate reporting and refine cross-channel analytics. This no-code platform allows users to collect, organize, transform, and visualize data to make informed decisions.
Analysis: Key Features, Benefits & Considerations
Over 700 pre-built integrations with CRMs, social media, accounting software, and others ensure seamless data collection, while visualization in Looker Studio and more platforms make real-time analytics accessible.
Their customizable dashboard templates and in-app dashboards assist businesses of different sizes to quickly start with reporting, saving time and resources.
The Coupler.io MCP Server and AI Insights serve as analytics agents for business automation, instantly interpreting large data sets in plain language to act smarter on cross-channel data.
Coupler.io pricing information
Free plan is available, and paid plans start at $24 per month.
BlazeSQL
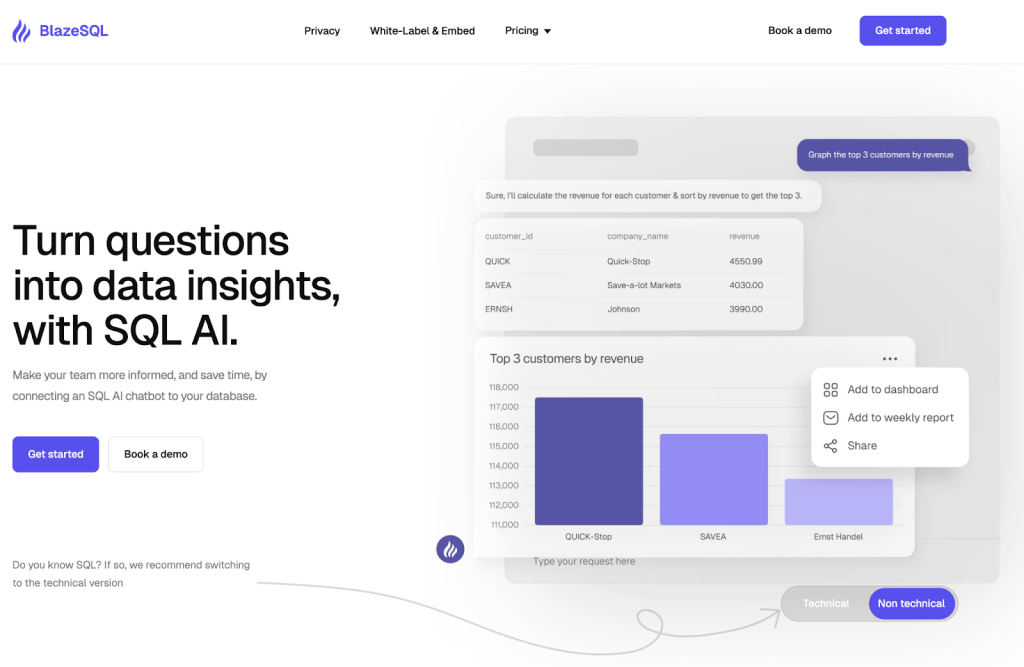
BlazeSQL is a collaborative SQL workspace designed to make querying, analyzing, and visualizing data faster and easier for teams.
Analysis: Key Features, Benefits & Considerations
BlazeSQL connects seamlessly to a wide range of databases, data warehouses, and cloud services, enabling instant access to live data without complex setup. With its intuitive query editor, AI-assisted SQL generation, and built-in visualization tools, both technical and non-technical users can explore and share insights efficiently.
Real-time collaboration features allow multiple team members to work on queries simultaneously, while permission controls ensure secure access to sensitive data. The platform also supports scheduled queries and automated reporting, helping teams stay updated without manual effort.
BlazeSQL pricing information
Free trial available and premium plans from $99/month.
Lumi AI
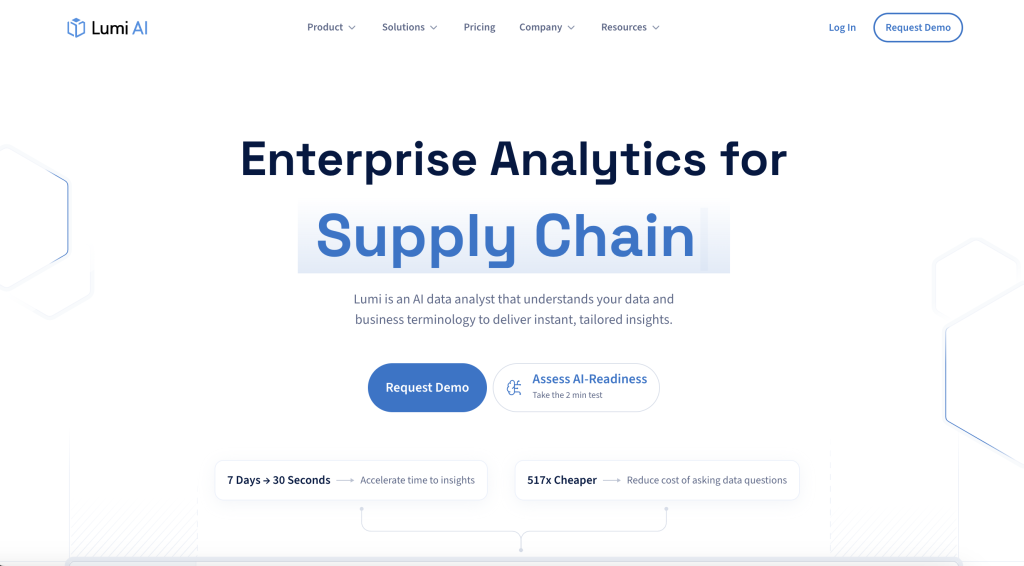
Lumi AI is an AI-driven platform for AI data analytics that helps businesses turn raw operational data into actionable insights across supply chain planning, sales and customer insights, and warehouse operations.
Analysis: Key Features, Benefits & Considerations
Lumi AI supports supply chain planning & visibility, sales & customer insights, and warehouse operations, giving teams full visibility over demand forecasting, fulfillment performance, customer behavior, and more.
The platform lets users ask data questions in plain language (no need for SQL or coding), and instantly get tailored reports and dashboards.
With integrations from ERPs and common data sources, businesses can collate and analyze data from multiple systems, enabling smarter decisions and cross-department insights.
Lumi AI Pricing Information
- Standard: $50 / user‑month
- Pro: $75 / user‑month
- Enterprise: Custom pricing for large deployments

Written by Andres Muñoz
If you would like to receive the latest deals added to NachoNacho, make sure you sign up for our newsletter below. We’re adding amazing software discounts you can’t miss!
Sign up for our newsletter

![Building a Website From Scratch Without Code [Guide]](https://blog.nachonacho.com/wp-content/uploads/2022/04/Building-a-Website-From-Scratch-Without-Code-Guide-768x274.png)